BTC price ignores US PCE data at $16.8K as Bitcoin rejects volatility
Bitcoin (BTC) saw a flicker of volatility around the Dec. 23 Wall Street open as the latest United States inflation data came in line with expectations.

Bitcoin sees "crumb" of volatility on PCE
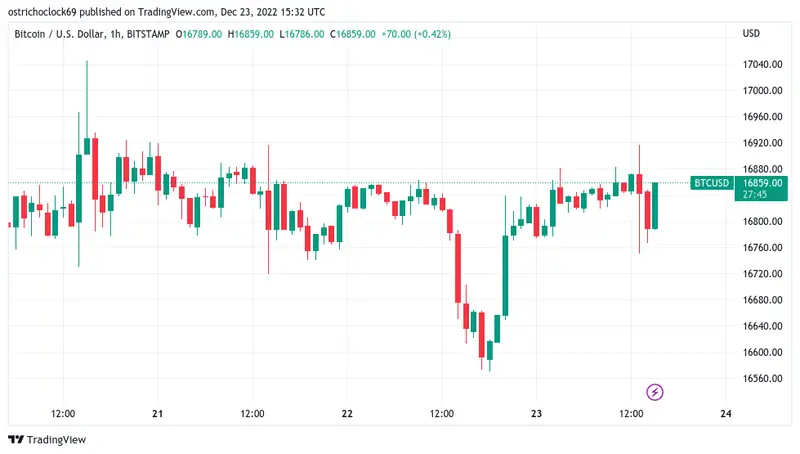
Data from Cointelegraph Markets Pro and TradingView showed BTC/USD briefly decoupling from solid sideways action to dip to $16,750 on Bitstamp.
The impact of the November U.S. Personal Consumption Expenditures (PCE) Price Index print was notably muted, this despite the data forming a key component of Federal Reserve policy.
Even in the low-volume, low-volatility environment Bitcoin continues to trade in, PCE barely moved markets as traders began to accept that Christmas 2022 may be an underwhelming one.
“Hope you enjoyed that little crumb of vol, it's probably the last,” popular Twitter account Byzantine General responded.
Core PCE was 4.7% for November, showing inflation retreating but still falling short of a bullish surprise for risk assets.
“A strong reaction from there, a quick flip of $16.750 as well,” Michaël van de Poppe, founder and CEO of trading firm Eight, wrote in part of Twitter Analysis on the day.
“If that holds, I'm assuming we break $16.9-17K and target $17.45K on Bitcoin. Otherwise, looking at longs lower at $16.45K.”
Fellow trader and analyst Il Capo of Crypto remained bearish, arguing that “the inability to break 17k says it all.”
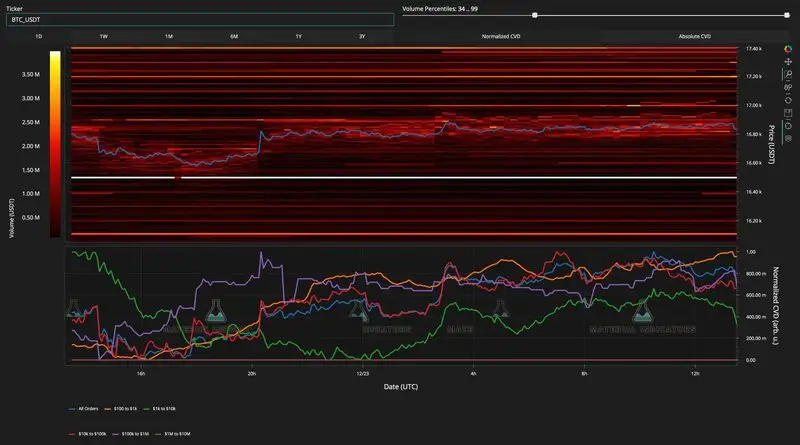
Data from on-chain analytics resource Material Indicators meanwhile showed significant bid interest parked at $16,500 on the Binance order book.

Data shows miner reluctance to sell on exchanges
Updating the picture regarding Bitcoin miners, on-chain analytics platform CryptoQuant meanwhile noted that transaction volumes had fallen in line with the broader trend.
Related: 'Wave lower' for all markets? 5 things to know in Bitcoin this week
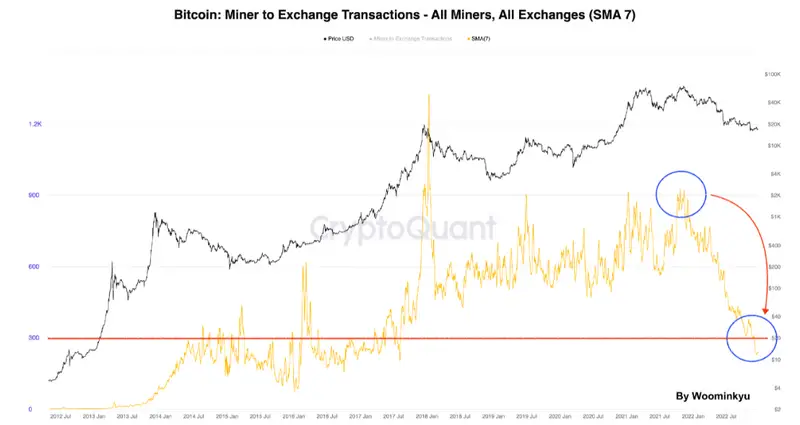
In a recent Quicktake blog post, contributor Woominkyu reiterated that macro bottoms in miner activity historically "roughly" coincided with BTC price bottoms.
"By seeing transactions from affiliated miners to all exchanges, it is clearly showing that selling pressures from miners’d been weakened since the late of 2021 until the present. Interestingly, it is noticeable that its transactions were very high while the price of BTC was considerably high as well," he wrote
"However, It does not indicate that miners are not able to sell more BTC at this moment but it is important to see that when its transactions go as low as the last bear cycles (Roughly), it is possible that BTC is forming a bottom too."
An accompanying chart showed transactions from miner wallets to exchanges, this taking a considerable hit since mid-2021.

The views, thoughts and opinions expressed here are the authors’ alone and do not necessarily reflect or represent the views and opinions of Cointelegraph.
Nhận xét
Đăng nhận xét