Strips Finance Price Prediction: STRP Gains 10% As Bulls Plan To Solidify Transient Highs
Strips Finance (STRP) price has been bullish lately, recording remarkable highs. However, the breakouts proved transient as the price closed within range levels. Since the onset of February, bulls have been working on solidifying these intraday highs. The resolve was successful for the first week, but recent profit-taking has stalled the effort.
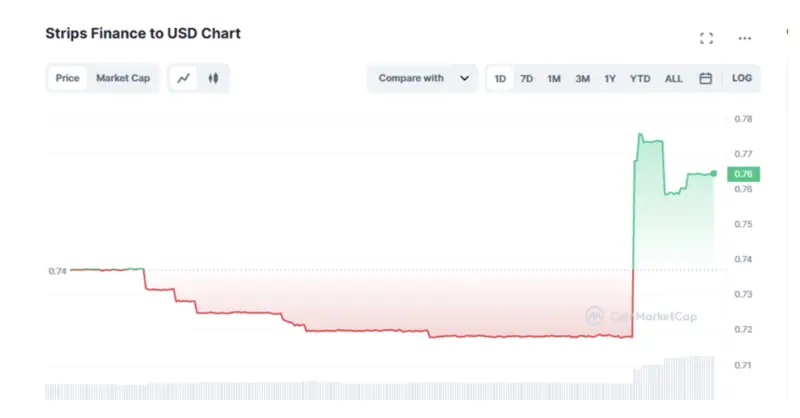
At the time of writing, STRP was auctioning for $0.7621. This was a 3.62% increase on the last day. Its market cap had also gained 3.66% to $3.15 million, in tandem with the price surge, but what was most astonishing was the 186% increase in 24-hour trading volume to $94,408.

Strips Finance recorded its highest price at $9.71 on October 15, 2021. Its lowest price was a cycle low of $0.083242, recorded on May 27, 2022. Since the last cycle low, the highest STRP price was $ 1.018560. Its circulating supply is 4.125 million STRP out of the maximum supply of 100 million STRP. As of press time, the STRP price prediction is bullish.
Notably, Strips Finance is the first revolutionary interest rate derivatives exchange on Arbitrum, designed for users to trade, speculate, and hedge interest rates conveniently.
Top Gainers in #Arbitrum Ecosystem Last 24 Hours 🚀
🥇 $HOP @HopProtocol
🥈 $FST @futureswapx
🥉 $UMAMI @UmamiFinance$CAP @CapDotFinance$NISHIB @NitroShiba$STRP @StripsFinance$FOREX @handle_fi$KROM @KromatikaFi$SWPR @SwaprEth$BBO @PandaGameFarm#Layer2 $AB #Ethereum #l2 pic.twitter.com/P2eHGeeBbn— Arbitrum Hub (💙,🧡) (@Arbitrum_Hub) February 24, 2023
It boasts an innovative automated market maker (AMM) technology that supports cross-chain yield markets on the most popular decentralized finance (DeFi) and centralized finance (CeFi) platforms.
Utility tokens$chng (defi for all)$strp (CEX-speed perp DEX on starknet)$xrt (skynet tech stack on blockchain)$was (tinder for gaming)$frm (dark horse of interoperability)$krom (gass-less swaps, aggregator, perps)$maha (fighting inflation with $arth)
— divineopera (@divineoperas) February 26, 2023
Strips Finance Ecosystem
Strips Finance is a hybrid decentralized derivatives exchange that enables users to trade with leverage across several markets. Through the platform, traders can transact safely and transparently with zero gas fees. The exchange also boasts leverage, 24/7 liquidity, and the most convenient trading experience. These are all building blocks to the platform’s commitment to becoming the foundation infrastructure layer for future decentralized financial derivatives.
STRP Bulls Seek A Return To $1.30
The market has been highly volatile for the STRP token, which had ultra-high intraday highs only to close the day lower. For instance, the token recorded an intraday high of $1.3 on February 5, only to close the day at $0.7. The narrative is repeated during several sessions across the month.
Today, February 27, STRP boasts an intraday high of $0.84 but was trading at $0.74 at the time of writing. This was a 12% difference. If the price managed to sustain these high levels, investors would be collecting enormous profits.
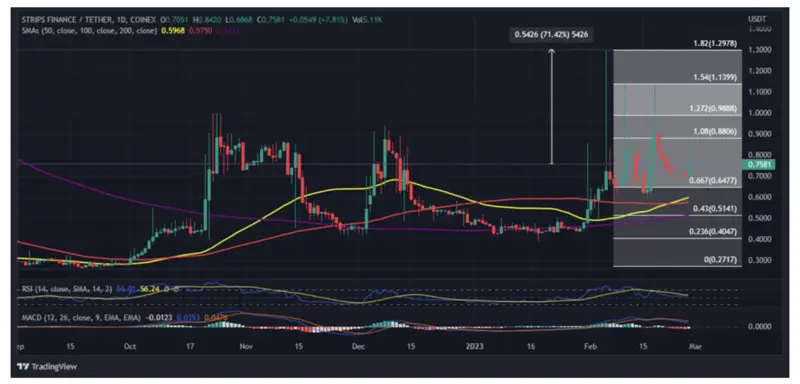
As bulls look to reclaim and sustain the $1.3 high recorded on February 5, the token was looking at a 71.42% increase from current levels.
The price was confronting immediate resistance at $0.8294. Breaking past this level could set the price on course to retrace certain key levels before reaching the $1.3 target. Increasing buying pressure from the current STRP rates could see bulls flip the roadblock into support. Notice the price momentarily sat above this hurdle before correcting lower. Investors should watch for a daily candlestick close above this level.
In such a scenario, the first logical move was the 108% Fibonacci retracement at $0.88. beyond that, the next move would be to revisit the 127.2% Fibonacci retracement at $0.989, or higher to the 154% Fibonacci retracement at $1.14. In highly bullish cases, the STRP could reclaim the $1.3 target marked by the 182% Fibonacci retracement.
STRP/USDT Daily Chart

The immediate support for STRP price was found at $0.7021. This bench had kept Strips Finance’s price afloat across a wide range of sessions, and losing it would be detrimental to the bulls.
The price also enjoyed the support offered by the Simple Moving Averages (SMAs), starting with the 50-day SMA at $0.596, the 100-day SMA at $0.5748, and the 200-day SMA at $0.5120. These supplier congestion zones were ideal breathing sheds for STRP bulls to reenter the market fresh and rejuvenated.
Take note of the relative strength index (RSI), which was still in the positive territory above the mean line. The price strength at 54 and the Stochastic RSI at 56 also inspired hope for more gains. Similarly, the moving average convergence divergence (MACD) was in the positive zone above the zero line. This indicated bulls had the upper hand. This is reinforced by the fading histograms that were losing the reddish touch.
On the downside, if investors decided to start booking profits, the STRP price could descend. In this direction, the first sensible visit would be the 66.7% Fibonacci retracement at $0.6477. Below that, the price could squat to the 43% Fibonacci retracement at $0.5141 embraced by the 200-day SMA or lower to the 23.6% Fibonacci retracement at $0.4047.
In the worst case, the price could revisit the $0.2717 support floor. This was a possibility, given the reddish histograms that signified the presence of bears in the market. In the same way, both the RSI and MACD were more inclined downward to show massive exits from the Strips Finance market.
STRP Alternative
If STRP looks like much of a risk, consider FGHT, the native asset of the Fight Out ecosystem. Buying this token provides an entrance into the revolutionary move-to-earn (M2E) ecosystem, where you can compete and earn rewards. You can also create your avatar, complete your Fight Out training and become the undisputed Fight Out champion.
FGHT token is in the presale stage, where they have collected more than $4.76 million in presale token sales. The presale will end on March 31, 2023.
$4.7M RAISED 🔥💪
Yet another milestone smashed 👏
The price of $FGHT is increasing every 12 hours! 👀
Buy now before it's too late! ⏰https://t.co/tIdxBuXB0f#Crypto #Presale #PlayToEarn #Web3 pic.twitter.com/1jqhQKto7T
— Fight Out (@FightOut_) February 25, 2023
Visit Fight Out here so as not to miss out for any reason.
Read More:
- Bitcoin Price Prediction for Today, February 27: BTC Price Rebounds but Risks Decline below $23K
- STPT Price Prediction – Will STPT Recover From Its Downtrend
- Europe’s Crypto Regulations Are Leaving US In The Dust, Ripple Exec Says
Nhận xét
Đăng nhận xét