MANA Soars As Market Optimism Returns, Next Stop $0.3713 Level
The current price action of Decentraland (MANA) indicates that market optimism is on the rise as the digital currency regains its bullish momentum, with the price now targeting the key resistance level of $0.3713. This recent surge in MANA’s price occurred following a price rejection at $0.3099, marked by the formation of a hammer candlestick pattern.
MANA has shown renewed strength, attracting investors and traders who are eagerly waiting for an opportunity to capitalize on the potential upward movement, especially as it approaches the critical resistance level of $0.3713.
As MANA targets the $0.3713 price level, this article aims to explore the current bullish sentiment surrounding the token, including technical indicators and market trends. It will also evaluate potential resistance and support levels that the crypto asset may face, offering insights into the overall market outlook.
At the time of writing, the price of MANA was trading around $0.3472, up by 5.41%, with a market capitalization of over $662 million and a trading volume exceeding $33 million. Over the last 24 hours, there has been a 5.51% increase in MANA’s market capitalization, while its trading volume has fallen by 16.99%.
Technical Analysis: Current Market Sentiment And Trends
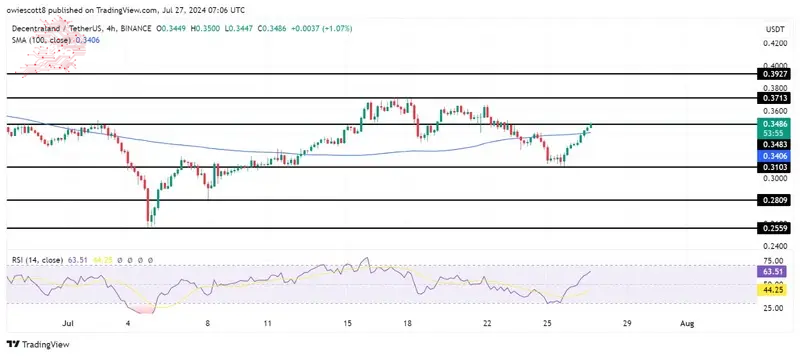
On the 4-hour chart, MANA has shown a significant bullish momentum as the price breaches the $0.3483 level and is now heading towards the key resistance level of $0.3713. Also, the price of MANA has successfully crossed above the 100-day Simple Moving Average (SMA), signaling a potential bullish trend and increased market confidence.

The Relative Strength Index (RSI) on the 4-hour chart has successfully crossed the 50% level and is now moving towards the 70% level, which is considered to be in the overbought range. This increasing bullish momentum indicates that buying pressure is strengthening.
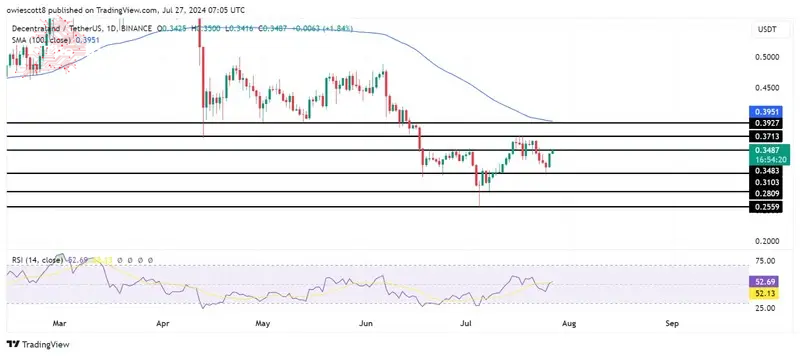
On the 1-day chart, although MANA is still currently trading below the 100-day SMA, the price has printed a hammer candlestick pattern followed by a bullish engulfing candle, which suggests a potential reversal from a downtrend to an uptrend.

The 1-day RSI indicators also suggest that the digital asset may continue its bullish rally toward the $0.3713 resistance level as the RSI line is trending above 50%.
Potential Scenarios For MANA
MANA is currently bullish targeting the key resistance level of $0.3713. A successful breakout above this resistance could signal further gains, potentially pushing the asset to the next resistance level at $0.3927 and other levels beyond.
If MANA’s price is rejected at $0.3713 and fails to break above the level, it may result in a retracement or consolidation. Should the crypto asset fall back and break through the support level of $0.3103, it could signal the potential for further downward movement, possibly targeting $0.2809 and other support ranges.

Nhận xét
Đăng nhận xét