Ethereum Price Plunges Below $4K As Whale Loses $45M, ETH ETF Inflows Plummet
The Ethereum price dropped 3% in the last 24 hours to trade at $3,991 as of 12:58 a.m. EST.
The ETH price plunge led to a $45.3 million loss for a whale investor after 9,152 ETH in its leveraged long position was liquidated when Ether’s price dropped below $4,000.
ETH just dropped below $4,000!
The biggest loser, 0xa523, just got WIPED.
His entire 9,152 $ETH($36.4M) long position was fully liquidated.
His total losses now exceed $45.3M, leaving him with less than $500K in his account.https://t.co/8C3XNE5tMS pic.twitter.com/JplqJl0cPy
— Lookonchain (@lookonchain) September 25, 2025
ETH’s decline is part of a broader market downturn triggered by macroeconomic fears, including a possible US government shutdown, which led to widespread liquidations of leveraged crypto positions.
Ethereum ETF (exchange-trade fund) inflows are suffering as a result. Net inflows this month are a meager $110 million, down from more than $3.8 billion in August.
This comes as on-chain data shows that Tether has minted 1 billion USDT on the Ethereum chain, valued at more than $1 billion.
Meanwhile, FalconX has introduced the first Ethereum staking rate forwards (FRAs), tied to the Treehouse Ethereum Staking Rate (TESR) benchmark.
🌳 A Major Milestone in DOR Adoption@FalconXGlobal has executed the first tradable Ethereum Staking Rate Forwards (FRAs) referencing TESR, the benchmark staking rate published by Treehouse.
Institutional participants include Edge Capital, Monarq, Mirana & more.
Read on. 🧵👇 pic.twitter.com/ZBPM8FUSD3
— Treehouse (@TreehouseFi) September 25, 2025
The initiative enables institutions to hedge or gain exposure to ETH staking yields through rate-based instruments, marking a step toward the development of a mature, institutional-grade crypto fixed income market.
ETH Price Faces Breakdown Risk As Momentum Weakens
The ETH price has recently shifted from a strong bullish rally into a corrective phase.
After reaching highs near $4,810, the market has rolled over and is now testing crucial support levels.
Currently, the Ethereum price has slipped below the 50-day moving average (blue line at $4,403), indicating that short-term momentum has turned bearish.
A descending move toward the 0.382 retracement at $3,826 is underway, and the next significant cluster of support lies near the 0.5 retracement at $3,522, which aligns with a prior consolidation zone.
The chart also shows an area around $3,200–$3,600, suggesting this range as a strong demand zone.
On the higher timeframe trend, the 200-day Simple Moving Average (SMA) (green line at $2,920) remains significantly below the current price of ETH, which maintains the overall market structure but signals room for further downside correction.
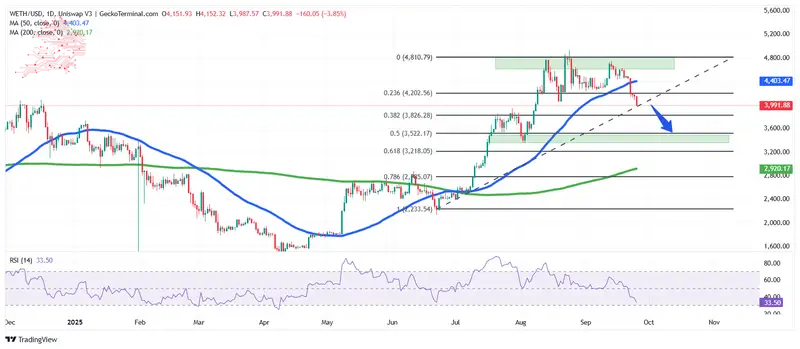
Ethereum Indicators Point to Weakening Momentum And Potential Support Zone
Technical indicators are supporting this shift in momentum. The Relative Strength Index (RSI) is currently at 33.50, near oversold territory.
This suggests that while bearish pressure is dominant, ETH may soon approach a level where buyers begin to step in, potentially leading to a rebound.
The Ethereum price is also trading below the 50-day SMA but still well above the 200-day SMA, which often reflects a medium-term bullish trend that is undergoing a pullback rather than a full reversal.
The Fibonacci levels reinforce this outlook: the 0.5 level at $3,522 and the 0.618 level at $3,218 are key areas to watch for a price reaction.
If the ETH price holds above the $3,500–$3,200 support band, the market could stabilize and attempt a recovery back toward $4,000, eventually retesting $4,200.
However, failure to hold this zone may open the path for a deeper retracement toward the 200-day SMA near $2,920.
Related News:
- BNB Price Pumps 3% After CZ Proposes Slashing Binance Chain Fees 50%
- Tether Seeks Up To $20 Billion Funding At $500 Billion Valuation
- OpenSea Adds Meebits #7421 Into Its NFT Reserve


Nhận xét
Đăng nhận xét